
FlessenVuller—Educatieve software om momentane snelheid te onderzoeken
Huub de Beer
1 Inleiding
You will find the international English version, FlaskFiller, here.
FlessenVuller is een leergereedschap om momentane snelheid te onderzoeken op de basisschool. Het is gemaakt als onderdeel van een onderzoek naar het onderwijzen van momentane snelheid in groep 7. Tijdens dit onderzoek zijn er een viertal onderwijsexperimenten uitgevoerd. In elk onderwijsexperiment werd een verbeterde versie van FlessenVuller gebruikt. Na het laatste experiment is een meer afgewerkte versie gemaakt. Je kunt deze laatste versie hier downloaden en gebruiken!
2 FlessenVuller gebruiken
2.1 FlessenVuller downloaden
De eenvoudigste manier om FlessenVuller te gebruiken is om het te openen in je webbrowser. Je kunt FlessenVuller vervolgens opslaan op je computer en het zonder internet gebruiken, met anderen delen via email, op je website zetten, enzovoorts. Een moderne webbrowser, zoals Firefox of Chromium, en het FlessenVuller HTML bestand is alles dat je nodig hebt om FlessenVuller te gebruiken.
Omdat FlessenVuller free software is kun je de broncode downloaden en aanpassen voor jouw situatie. Zie hiervoor de paragraaf over het aanpassen van FlessenVuller.
2.2 Het onderzoeken van het vullen van glazen met behulp van FlessenVuller
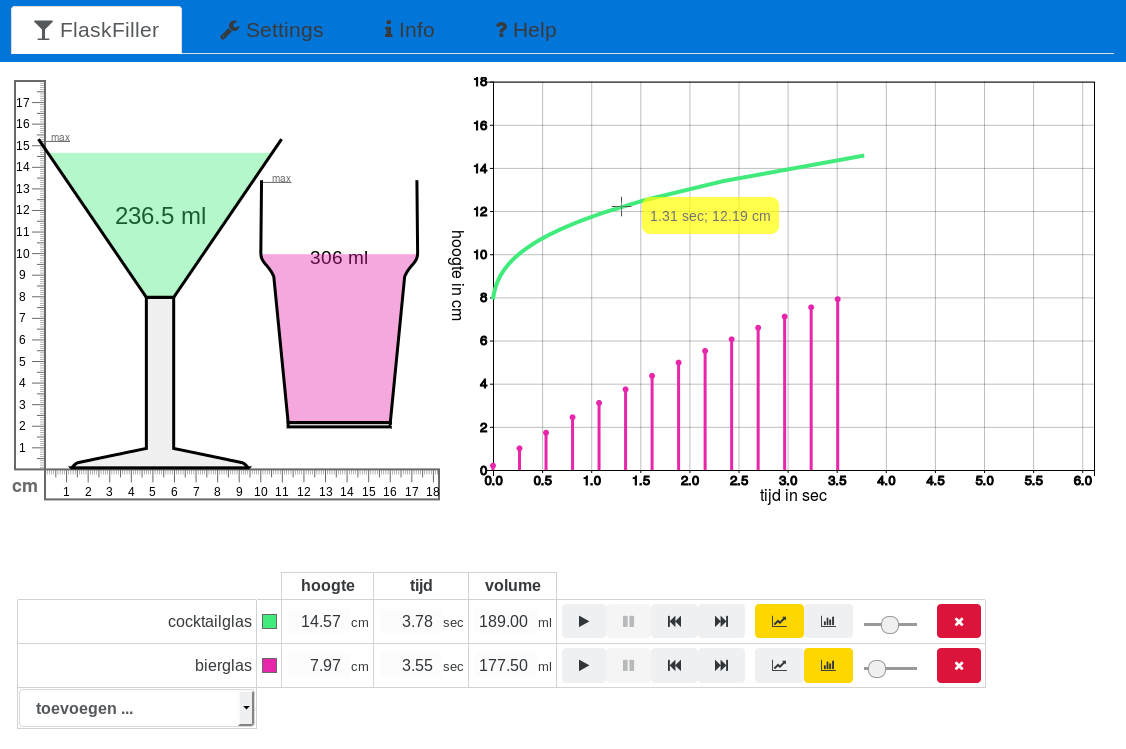
FlessenVuller bestaat uit vier configureerbare en samenhangende onderdelen (zie Figuur 1):
-
In Figuur 1 zie je de simulatie van een cocktailglas met een groene vloeistof en een bierglas met een paarse vloeistof. Om de simulatie te starten, dubbelklik je op een glas of je gebruikt de besturing (zie de beschrijving van het laatste component hieronder). Als je vervolgens op het glas klikt, wordt de simulatie gepauzeerd. De simulatie verloopt synchroon met het tekenen van de grafiek en het verlopen van de waarden in de tabel (en vice versa).
Je kunt glazen verslepen in de simulatie. Als je een glas over een ander glas sleept, springt het naar de midlijn van dat andere glas. Dit maakt het gemakkelijker om verschillende glazen op elkaar te leggen.
Merk overigens op dat de plaats van een glas in de simulatie geen invloed heeft op de andere onderdelen van FlessenVuller. Zoals je in Figuur 1 kunt zien is het bierglas zo’n 2cm verplaatst, maar de grafiek van het bierglas begint nog steeds op 0cm. Dit is welbewust.
Als je je muiscursor over een lineaal beweegt, verschijnt er een rood hulplijntje.
-
In de grafiek zie je een lijngrafiek van het cocktailglas en een staafdiagram van het bierglas. FlessenVuller heeft nog een derde type grafiek: de pijlgrafiek. Je kunt de pijlgrafiek activeren middels het instellingentabblad. (Het instellingentabblad wordt in de volgende paragraaf besproken)
In Figuur 1 hangt de muiscursor boven de lijngrafiek van het cocktailglas op het punt (1.31s, 12.19cm). Je kunt FlessenVuller configureren om verschillende aspecten van de door de grafiek beschreven situatie in een punt te laten zien. Daarnaast kun je kiezen welke grootheden op de assen tegen elkaar uit te zetten. FlessenVuller kent de grootheden hoogte, tijd, volume en stijgsnelheid.
-
Onderaan zie je de besturingscomponent tezamen met de tabel (die later wordt beschreven). Met behulp can de besturing kun je de simualtie starten, pauzeren, stoppen en afronden. Je kunt ook de verschillende typen grafieken verbergen of tevoorschijn laten komen en de stapgrootte van de stappen tussen opeenvolgende staafjes of pijltjes aanpassen. Om de kleur van de vloeistof in een glas te veranderen, klik je op het vierkantje met die kleur.
Via de besturingscomponent kun je ook een glas toevoegen of verwijderen. Merk op dat een uitrekbaar longdrinkglas toegevoegd kan worden. Dit is het enige glas dat meerdere keren toegevoegd kan worden. Dit glas is te meer bijzonder omdat je de grootte ervan kunt aanpassen door het handvat in de rechterbovenhoek te verslepen.
-
Tot slot kun je de situatie kwantitatief laten beschrijven met behulp van de tabel. De tabel is gecombineerd met de besturing. Je kunt configureren welke grootheden je in de tabel wilt zien. De waarden van deze grootheden kun je aanpassen. Zo kun je bijvoorbeeld het volume in het cocktail glas veranderen naar 100ml. Druk je op Enter, dan wordt deze verandering doorgevoerd in alle onderdelen van FlessenVuller.
Elke component, behalve de besturing, kan verborgen worden. Als het webbrowservenster te smal is, dan wordt de grafiek onder de simulatie geplaatst. Pas je de grootte van het webbrowservenster aan dien je de pagina te herladen om FlessenVuller van de nieuwe grootte gebruik te laten maken.
2.3 Instellen van FlessenVuller
FlessenVuller is zeer configureerbaar. De instellingen worden in de webbrowser opgeslagen. Als je FlessenVuller opnieuw opent in dezelfde webbrowser dan worden de instellingen van het laatste gebruik geladen.
Open het instellingentabblad om de volgende aspecten van FlessenVuller in te stellen:
-
Algemeen: kies welke onderdelen van FlessenVuller worden getoond of verborgen. Standaard worden de simulatie, grafiek, tabel en besturing getoond. Je kunt de besturing niet verbergen.
-
Simulatie: kies de hoogte van de gesimuleerde wereld. Na het aanpassen van de hoogte moet FlessenVuller opnieuwe geladen worden om de verandering door te voeren.
-
Grafiek:
-
Selecteer de grootheid van de horizontale as. Kies een van hoogte, tijd, volume of stijgsnelheid.
-
Selecteer de grootheid van de verticale as. Kies een van hoogte, tijd, volume of stijgsnelheid. Merk op dat je dezelfde grootheid voor beide assen kunt selecteren. Dit kan een interessant onderwerp voor een discussie zijn.
-
Selecteer welke grafiektypen getoond kunnen worden. Deze typen zijn:
- lijngrafiek
- staafdiagram
- pijldiagram
Je kunt een grafiek van een bepaald glas verbergen of tonen door het bijbehorende icoontje in de besturing te activeren.
-
Opties:
- Toon de coordinaten van het punt op een lijngrafiek waar de muiscursor wijst.
- Toon de stijgsnelheid in het punt op een lijngrafiek waar de muiscursor wijst.
- Toon de raaklijn aan het punt op een lijngrafiek waar de muiscursor wijst.
- Laat een stapgrootte schuif zien om de afstand tussen opeenvolgende staafjes of pijlen te veranderen.
- Maak de lijngrafieken van de uitrekbare longdrinkglaasjes verplaatsbaar. Dit stelt je in staat om deze lijngrafieken over andere grafieken te slepen om zo het idee van een raaklijn te onderzoeken.
-
-
Tabel:
- selecteer welke grootheden getoond worden. Je kunt de grootheden hoogte, tijd, volume en stijgsnelheid tonen. - selecteer of *de naam van een glas verborgen* moet worden. Dit kun je bijvoorbeeld gebruiken om leerlingen, gegeven een stijgsnelheid/tijd grafiek het bijbehorende glas te ontwerpen. -
Besturing: selecteer welke glazen aan FlessenVuller toegevoegd kunnen worden. Je kunt uit de volgende glazen kiezen:
- cocktailglas. Dit wordt standaard getoond als het aangevinkt is
- longdrinkglas
- uitrekbaar longdrinkglas. Dit kan meerdere keren toegevoegd worden
- wijnglas
- cognacglas
- bierglas.
Als FlessenVuller opnieuw opgestart moet worden om de veranderingen door te voeren, wordt een bericht getoond bovenaan het instellingentabblad.
3 Aanpassen van FlessenVuller
3.1 FlessenVuller is free software
FlessenVuller is free software en wordt vrijgegeven onder de GPL versie 3. Dit houdt in dat je de software mag aanpassen, gebruiken, en verspreiden zolang je eventuele aanpassingen onder dezelfde licentie vrijgeeft. De FlessenVuller broncode is gepubliceerd op github.
FlessenVuller maakt gebruik van de volgende bibliotheken:
- De simulatiecomponent is gemaakt met behulp van Raphaël.js
- De grafiekcomponent met d3
- De gebruikersinterface met Bootstrap en jQuery
- De icoontjes zijn van Font Awesome
4 Pas FlessenVuller aan aan jouw situatie
De broncode van FlessenVuller kan gedownload worden van de broncode repository. Je kunt de broncode klonen op je computer. Je doet dit op een unix-achtig besturingssysteem als volgt:
git clone https://github.com/htdebeer/flaskfiller.git
cd flaskfiller
npm install
Als je de JavaScript broncode aanpast, gebruik dan npm run
build om een nieuwe versie can de basisbibliotheek van
FlessenVuller te genereren.
Om een standalone versie van FlessenVuller of een aangepaste versie te
maken, is een Bash
script bijgevoegd: create_standalone.sh. Dit script maakt
gebruik van Pandoc om een standalone
versie te genereren waarin alle assets zijn ingevoegd.